Since I already have charts made on NZ debt levels and debt deleveraging seems to be affecting the economy more than peak oil I thought I’d take a quick diversion. The weak recovery has surprised economists. A few months ago most were anticipating consumers to spend more before the GST increase. Here’s Shamubeel Eaqub from the NZIER:
“There was no evidence of a pre-GST [increase] spend up at shops. Large firms, which had been recovering strongly, fell sharply, and small firms remained in the doldrums.
“Business profitability is deteriorating again; highly unusual for this stage of the recovery. This may weigh on future hiring and investment although hiring and investment intentions remain encouragingly resilient.”
While many commodity prices – in particular dairy – continue to boom, the domestic economy remains weak as farmers and households focus on paying down debt, even before the recent changes to the tax system, which were designed to encourage saving.
Mr Eaqub said the move to pay down household and corporate debt was hurting the economy at present, but the process would leave the economy in a better position.”*
Paying down debt? According to the consensus forecasts¹ from a few months back, consumers were supposed to spending again. This raises the question of how high debt levels affect the economy (and whether orthodox economics has a good handle on this). Bernard Hickey has been beating the debt-deleveraging drum for a while³. While Matt Nolan has called for a thorough look at the data².
I’ll present NZ debt data further down but before getting to that we should note that across the Tasman, University of NSW Western Sydney Professor Steve Keen has done a lot of work on debt levels. Keen is in the Post-Keynesian school of economics and rejects a lot of orthodox theory, having written the book Debunking Economics. Keen has a pretty clear explanation for the cause of the financial crisis: Too much debt. Keen regards the current situation as comparable to the Great Depression. Here’s a chart of private debt levels in the USA, then and now I poached from Keen’s post*.
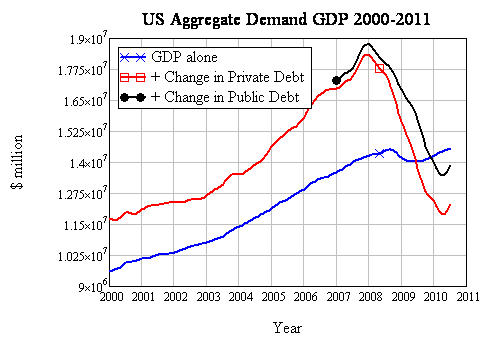
Looks somewhat ominous doesn’t it? In Keen’s view, aggregate demand is GDP + the change in debt, an approach which recognises that asset markets and consumption are mixed. Here’s the USA’s aggregate demand:
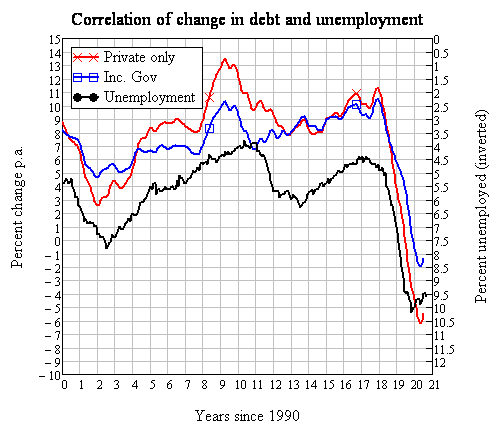
And here’s the correlation with unemployment:
Keen points out that change in debt is the leads change in employment while gdp lags. I recommend reading the rest of Keen’s post and The Roving Cavalier’s of Credit* for the theoretical background. The rest of this post merely presents NZ data from the RBNZ in the same framework.
Total debt ratios are comparable to levels preceding the Great Depression. Businesses and consumer debt have been deleveraging for a while now, while agriculture and mortgage debt have slowed down. A rise in government debt has only barely offset a decrease in private debt. Let’s look at aggregate demand:
Right around the start of 2008 aggregate demand has fallen, slowed down by an increase in government debt.
Now let’s take a look at the correlation with unemployment:
Looks to me like debt deleveraging explains current economic weakness well. If debt levels reset around 50-100% of GDP, that’s going to take a decade or two. The obvious question is why orthodox economics have missed the role of debt accumulation until quite recently
2 Brief Thoughts on NZ’s Debt Position


Prof. Keen is tenured at the University of Western Sydney and not UNSW
Thanks Bob,
post edited
Pingback: NZ Investment Property